
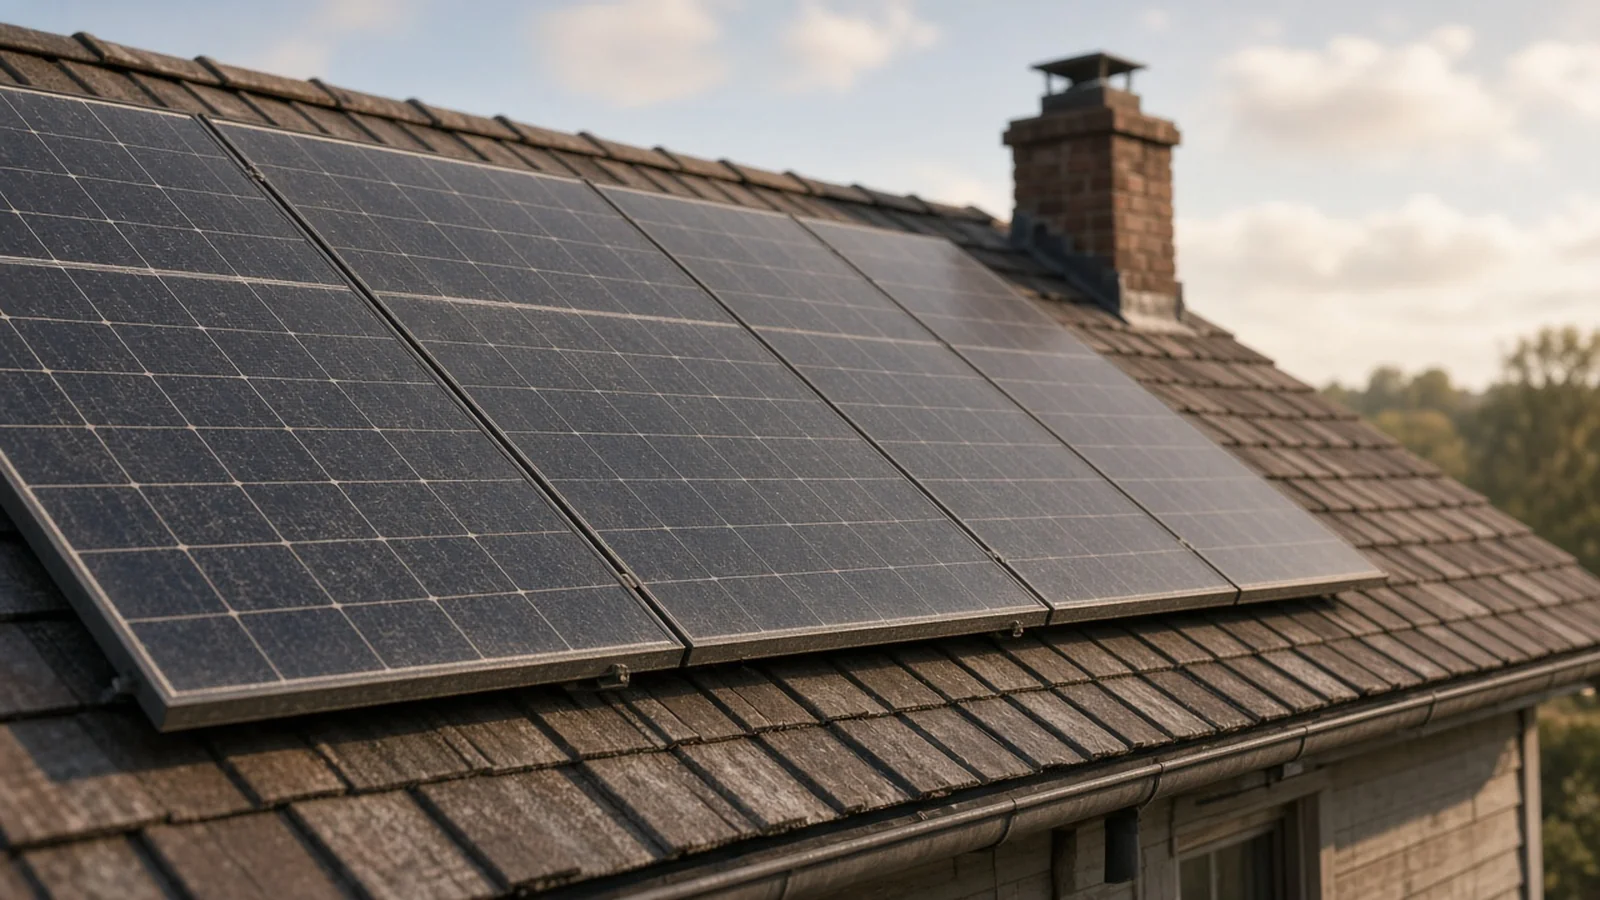
Every off-grid solar plan rests on one quiet assumption: the panels you bolt to the roof this year will still make close to the same power in ten years. If they don't, your batteries charge less in winter, your generator runs more, and the system you sized so carefully slowly turns undersized.
So how fast do panels actually lose power? The best recent answer comes from the U.S. Department of Energy's PV Lifetime Project. Its 2025 annual report, published in February 2026 by the National Laboratory of the Rockies (the lab formerly called NREL), pulls together up to nine years of careful measurements on 16 commercial panel types. Here's what it found, what it doesn't prove, and what it means for your own array.
The study in one paragraph
Since 2016, the lab has installed rows of ordinary commercial panels outdoors in Golden, Colorado, wired to the grid like any normal system. Once or twice a year, a subset of those panels is taken down and flash-tested indoors under standard test conditions (25 °C and 1,000 W/m² of light), then put back outside. Identical "control" panels that never go outdoors are tested the same way, so the team can separate real field wear from drift in the test equipment. Across the whole project, the national labs (the work is shared with Sandia) have deployed more than 950 panels from 12 manufacturers at sites in Colorado, New Mexico and Florida. This report covers the Colorado panels.
Study type: a long-term field test with indoor lab measurements. It is a government technical report (NLR/TP-5K00-98639), reviewed by the lab, not a peer-reviewed journal paper. Earlier data from the same project has been published in peer-reviewed journals, including Progress in Photovoltaics in 2022.
What they found
The headline number is the median yearly loss in maximum power for each panel type. Here are the results from the report's summary table:
| Panel (type) | Deployed | Median loss per year | Total change so far |
|---|---|---|---|
| Mission Solar MSE360 (mono PERC) | Dec 2018 | −0.15% | −0.73% |
| LG 320N1K (n-type mono) | Aug 2018 | −0.21% | −1.72% |
| Panasonic VBHN330 (heterojunction) | Jun 2018 | −0.29% | −1.90% |
| LONGi LR6-72PH-365M (mono PERC) | Nov 2020 | −0.32% | −2.08% |
| Trina TSM255 (multi) | Oct 2016 | −0.38% | −3.41% |
| LONGi LR6-72BP-360M (bifacial PERC) | Nov 2020 | −0.40% | −2.06% |
| Q-Cells Q.Plus 280 (multi PERC) | Oct 2017 | −0.41% | −3.36% |
| Jinko JKM265 (multi) | Oct 2016 | −0.42% | −3.90% |
| Jinko JKM260 (multi) | Oct 2016 | −0.44% | −4.11% |
| Canadian Solar CS6K-300MS (mono PERC) | Aug 2018 | −0.46% | −2.73% |
| Trina TSM260 (multi) | Oct 2016 | −0.47% | −3.42% |
| Q-Cells Q.Peak 290 (mono PERC) | Oct 2017 | −0.48% | −3.18% |
| Prism Solar BN72 (bifacial PERC) | Oct 2019 | −1.16% | −5.30% |
| Sunpreme HxB-400 (bifacial heterojunction) | Mar 2019 | −1.56% | −10.11% |
| Solaria PowerX-400R (shingled PERC) | Nov 2023 | −1.95% | −3.21% |
| REC 405AA Pure (n-type heterojunction) | Nov 2023 | −3.85% | −6.83% |
| REC 360NP2 (n-type TOPCon) | Nov 2023 | +0.13% | +0.23% |
Four findings stand out:
- Most panels age slowly. Twelve of the 16 types lost less than 0.5% a year. The oldest group (Jinko, Trina and Q-Cells, in the field since 2016 and 2017) sits between −0.4% and −0.5% a year, and the report notes that much of that loss happened in the first year.
- A few age fast. Four types lost more than 1% a year: two n-type heterojunction panels, one bifacial PERC and one shingled PERC. The Sunpreme bifacial panels have lost over 10% in total. The REC 405AA Pure panels lost 6.8% in only a year and a half.
- Newer isn't automatically better. Of the four newest panel types, only one, the REC 360NP2 TOPCon, beat the average. It actually gained slightly over its first year and a half.
- Not every panel starts at its label. When first measured, most types came in at nameplate or within 1%. Mission Solar and Solaria came in 2% to 3% below, and the REC 405 Pure Alpha 3% to 4% below, which the report says is outside its stated accuracy. LG came in 2% above.
The report also spotted a seasonal "sawtooth" in some panel types (Jinko, Trina and Mission Solar). Power dips after long hot spells and recovers in cooler months. That pattern is consistent with LeTID (light and elevated temperature-induced degradation), a known effect in some silicon cells.
One more real-world detail: the Jinko and Trina panels went through a May 2017 hailstorm in Golden with hail up to 50 mm (egg-sized). No glass broke, but imaging later found cracked cells, with 3 to 4 cracked cells typical on the Jinko panels and cracks on 10% to 30% of cells typical on the hail-damaged Trina panels. Those panels still landed in the normal −0.4% to −0.5% a year range.
What it means in plain numbers
To see why the rate matters, here's simple compounding math (our illustration, not a figure from the report). A panel losing 0.5% a year keeps about 95% of its starting power after 10 years. A panel losing 1.5% a year keeps about 86%. On a 4 kW off-grid array, that gap is roughly 360 W of winter charging you no longer have, before you count dust, shade or wiring losses.
For most well-made panels, the takeaway is reassuring. A loss of under half a percent a year is small next to the things that really drain off-grid systems: snow cover, dirty glass, a tree that grew into the winter sun path, or a battery bank sized too tight.
What's still unproven
Be careful about reading this table as a buyer's ranking.
- Small samples, one site. The Colorado systems run from about 10 to 30 panels per type, and only a subset is pulled indoors each time. Golden's climate isn't Arizona's or Florida's.
- Short records for new panels. The three 2023 types have only about a year and a half of data. The report itself says it "remains to be seen" if their early losses continue. Early losses can stabilize, as the Prism Solar panels appear to have done.
- These are specific models, not whole brands or technologies. One fast-degrading heterojunction model doesn't condemn all heterojunction panels, and one good TOPCon model doesn't prove every TOPCon panel will match it.
- Measurement shifts. The lab changed test procedures in 2025 and adjusted older data by up to 1% to match a new reference panel. The summary numbers aren't corrected for control-panel drift unless noted.
- Panel loss isn't system loss. The report measures the panel itself. It leaves out soiling, wiring, inverter or charge-controller faults, and shading. The lab's separate PV Fleet project, which analyzes data from over 5,000 large systems, reported preliminary findings in early 2026 that tracked utility arrays lost about 0.5% a year more than fixed-tilt ones, with stuck tracker rows a suspected cause. That's a reminder that the balance of system often matters as much as the panels.
The lab also states plainly that publishing the data doesn't endorse any manufacturer.
What to do with this on your homestead
1. Size with a margin. When you run the numbers in our off-grid solar calculator, add some headroom to the array rather than sizing to the exact watt. Around 0.5% a year of loss is normal, so a system that just barely covers your winter load today will fall short in a decade.
2. Check the label against reality early. The report found that some panels started 2% to 4% below their rating. Within the first months, compare each panel's open-circuit voltage and short-circuit current on the same clear day, at the same time. One panel well below its neighbors is a warranty question while it's still easy to raise.
3. Read the warranty's degradation clause. Most panel warranties promise a minimum percentage of rated output after a set number of years. Field data like this tells you whether that promise is likely to matter. Keep your invoice and serial numbers.
4. Log your own production. Your charge controller or inverter app already records daily solar harvest. Compare the same clear-sky month year over year. A slow drift is normal. A sudden drop usually points to dirt, shade, a loose connector or a failing panel, which you can fix.
5. Don't buy on technology buzzwords alone. "N-type" or "bifacial" on a spec sheet isn't proof of slow aging. Favor models with a track record in independent field data, a solid warranty, and a seller who will honor it.
What to use or try
If you want to design and maintain your own system with this kind of rigor, two books in our Regenerative Library cover it well:
- Photovoltaics: Design and Installation Manual by Solar Energy International. It's the training manual for SEI's design and installation workshops and covers sizing, site analysis, maintenance and safety.
- Solar Electricity Handbook (2023 Edition) by Michael Boxwell. It's a plain-language guide to designing and installing a solar PV system from scratch, with companion online calculators.
Shopping for a complete system instead? Our off-grid solar kits comparison and the Power hub walk through the options, and Living Off the Grid With Solar Power is the place to start if you're new.
Sources
- Deline, C., Jordan, D., Sekulic, B., Parker, J., Getabecha, H., McDanold, B., and Anderberg, A. (2026). PV Lifetime Project – 2025 NLR Annual Report. National Laboratory of the Rockies, Golden, CO. Technical Report NLR/TP-5K00-98639. https://doi.org/10.2172/3020423 (full text via OSTI.gov).
- Deline, C., Perry, K., Springer, M., Jordan, D., Muller, M., White, R., Ovaitt, S., and Meyers, B. (2026). PV Fleet Performance Data Initiative 2026 Update. 16th PV Reliability Workshop, National Laboratory of the Rockies. https://doi.org/10.2172/3364908 (summary on the NLR research hub).
- Theristis, M., Stein, J.S., Deline, C., et al. (2022). "Onymous early-life performance degradation analysis of recent photovoltaic module technologies." Progress in Photovoltaics. https://doi.org/10.1002/pip.3615 (cited in the 2025 report as related peer-reviewed work).